Grower's Guide
|
| Detailed Crop Weather Data | |||||||||||||
| Date |
Average Temp (f) |
Dew Point (f) |
Max Dewpoint (f) |
Min Dewpoint (f) |
Wind Run (miles/day) |
Soil Temp (f) |
|||||||
| Jan 23, 2026 - Fri | 69 | 68 | 75 | 60 | 176 | 68 | |||||||
| Jan 22, 2026 - Thu | 65 | 65 | 71 | 60 | 91 | 66 | |||||||
| Jan 21, 2026 - Wed | 68 | 66 | 69 | 61 | 131 | 66 | |||||||
| Jan 20, 2026 - Tue | 63 | 59 | 66 | 52 | 138 | 63 | |||||||
| Jan 19, 2026 - Mon | 53 | 39 | 52 | 24 | 143 | 59 | |||||||
| Jan 18, 2026 - Sun | 46 | 24 | 30 | 18 | 119 | 60 | |||||||
| Jan 17, 2026 - Sat | 57 | 31 | 41 | 25 | 329 | 63 | |||||||
| Jan 16, 2026 - Fri | 60 | 53 | 66 | 42 | 184 | 62 | |||||||
| Jan 15, 2026 - Thu | 54 | 37 | 43 | 31 | 153 | 62 | |||||||
| Jan 14, 2026 - Wed | 58 | 46 | 51 | 37 | 151 | 62 | |||||||
| Jan 13, 2026 - Tue | 55 | 45 | 52 | 42 | 97 | 62 | |||||||
| Jan 12, 2026 - Mon | 56 | 35 | 45 | 28 | 122 | 63 | |||||||
| Jan 11, 2026 - Sun | 55 | 31 | 34 | 25 | 189 | 64 | |||||||
| Data Summary | 58 | 46 | 75 | 18 | 2,023 | 63 | |||||||
| Heat Units | |||||||||||||
| Date |
Corn (heat units) |
Cotton (heat units) |
Sorghum (heat units) |
50 Degree (heat units) |
55 Degree (heat units) |
60 Degree (heat units) |
|||||||
| Jan 23, 2026 - Fri | 19 | 9 | 14 | 19 | 14 | 9 | |||||||
| Jan 22, 2026 - Thu | 16 | 6 | 11 | 16 | 11 | 6 | |||||||
| Jan 21, 2026 - Wed | 18 | 8 | 13 | 18 | 13 | 8 | |||||||
| Jan 20, 2026 - Tue | 13 | 3 | 8 | 13 | 8 | 3 | |||||||
| Jan 19, 2026 - Mon | 2 | 0 | 0 | 2 | 0 | 0 | |||||||
| Jan 18, 2026 - Sun | 0 | 0 | 0 | 0 | 0 | 0 | |||||||
| Jan 17, 2026 - Sat | 5 | 0 | 0 | 5 | 0 | 0 | |||||||
| Jan 16, 2026 - Fri | 10 | 0 | 5 | 10 | 5 | 0 | |||||||
| Jan 15, 2026 - Thu | 4 | 0 | 0 | 4 | 0 | 0 | |||||||
| Jan 14, 2026 - Wed | 8 | 0 | 3 | 8 | 3 | 0 | |||||||
| Jan 13, 2026 - Tue | 5 | 0 | 0 | 5 | 0 | 0 | |||||||
| Jan 12, 2026 - Mon | 7 | 0 | 2 | 7 | 2 | 0 | |||||||
| Jan 11, 2026 - Sun | 5 | 0 | 0 | 5 | 0 | 0 | |||||||
| Data Summary | 112 | 26 | 56 | 112 | 56 | 26 | |||||||
| Chilling Hours | ||
| Date |
Method 1 (Hours >= 32 & <= 45 F) |
Method 2 (Hours <= 45 F) |
| Jan 23, 2026 - Fri | 0 | 0 |
| Jan 22, 2026 - Thu | 0 | 0 |
| Jan 21, 2026 - Wed | 0 | 0 |
| Jan 20, 2026 - Tue | 0 | 0 |
| Jan 19, 2026 - Mon | 10 | 10 |
| Jan 18, 2026 - Sun | 12 | 12 |
| Jan 17, 2026 - Sat | 0 | 0 |
| Jan 16, 2026 - Fri | 4 | 4 |
| Jan 15, 2026 - Thu | 1 | 1 |
| Jan 14, 2026 - Wed | 2 | 2 |
| Jan 13, 2026 - Tue | 0 | 0 |
| Jan 12, 2026 - Mon | 0 | 0 |
| Jan 11, 2026 - Sun | 0 | 0 |
| Data Summary | 29 | 29 |
|
Chilling Hours for the 2025-2026 Season October 1, 2025 thru March 31, 2026 |
||
| Month |
Method 1 (Hours >= 32 & <= 45 F) |
Method 2 (Hours <= 45 F) |
| Oct | 0 | 0 |
| Nov | 1 | 1 |
| Dec | 32 | 32 |
| Jan | 29 | 29 |
| Total | 62 | 62 |
|
|||||||||||||||
|
|||||||||||||||
|
||||||||||||||||||||||||||||||
|
||||||||||||||||||||||||||||||
METHOD 1: Select your weather station. Choose the number of days to be included: 3-day summary, 5-day summary, 7-day summary or 2-week summary (by default, the 7-day summary is shown). Choose the calculator: Landscape or Crop. The calculator is automatically populated with the ETo total for the number of days listed and with rainfall. If your rainfall is different, enter it. Fill in the remaining variables and click "Compute" to determine the water needs for your landscape or crop. METHOD 2: Track the daily and weekly ETo values and use this information subjectively to estimate water needs. METHOD 3: Use the average historic ETo values to determine seasonal irrigation water needs and establish monthly irrigation schedules.
Click the link below to obtain a copy of the Website User's Manual: Texas ET Network and Website User's Manual
|
|
Evapotranspiration
(ET)
is a measurement of the total amount of water
needed to grow plants and crops. This term comes from
the words evaporation (i.e., evaporation
of water from the soil) and transpiration
(i.e., transpiration of water by plants). Different
plants have different water requirements, so they have
different ET rates.
In 1948, a British scientist name Howard Penman presented a theory (i.e., mathematical model) for calculating ET using local climate data. The resulting Penman equation has been modified since, but forms of this equation are still used today for this purpose. Since there are thousands of cultivated plants, scientists simplified matters by establishing a standard ET rate for general reference and use. The standard is referred to as the potential evapotranspiration ETo (pet) . This is the "potential" ET since we are assuming the crop is in a deep soil and under well watered conditions. A cool-season grass is widely used for this standard crop. The technical term for this is the "Potential Evapotranspiration of a Grass Reference Crop" or "ETo" for short. ETo depends on the climate and varies from location to location. Special weather stations are used to collect the climatic data for calculating ETo, including temperature, dew point temperature (relative humidity), wind, and solar radiation. The American Society of Biological and Agricultural Engineers has established a standard for weather stations used for calculation of ET which can be found on this website. The water requirements of specific crops and turf grasses can be calculated as a fraction of the ETo. This "fraction" is the called the crop coefficient (Kc) or turf coefficient (Tc). Crop coefficients vary depending on the type of plant and its stage of growth. Detailed information on crop and turf coefficients and how to use them is presented at other locations on this website. We are using the standardized Penman-Monteith method to calculate ETo from the weather station data. This method is also referred to as the ASCE standard method (for more info, see: The ASCE Standardized Reference Evapotranspiration Equation | Books (ascelibrary.org) . This is one of several methods that can be used to determine ETo and ET. Organizations, such as the International Committee on Irrigation and Drainage and the Water Requirements Committee of the American Society of Civil Engineers, have proposed establishing the Penman-Monteith method as a world-wide standard. Such a standard would help facilitate the sharing of ETo data and development of crop coefficients. For more information on the Penman-Monteith equation see the FAO website . For information on the standardized equation and other methods for determining ET, see the book: Evapotranspiration and Irrigation Water Requirements, edited by M.E. Jensen, R.D. Burman, and R.G. Allen. Published by the American Society of Civil Engineers, New York, NY. 2016. https://doi.org/10.1061/9780784414057 |
|
Typical
Overall On-Farm Efficiencies
|
||||||||||||
|
footnotes: 1. Surge has been found to increase efficiencies 8 to 28 percent over non-surge furrow systems. 2. Trickle systems are typically designed at 90 percent efficiency; short laterals (<100ft) or systems with pressure compensationg emitters may have higher efficiencies. 3. Under low wind conditions. |
|
|
||||||||||||||||||||||||||||||||||
|
||||||||||||||||||||||||||||||||||||||||||||||||||||||||||||||||||||||
Evapotranspiration (ETo) is an estimate of the total water requirements of a 4-inch tall, cool season grass in a deep soil growing under well-watered conditions. This reference grass is modeled after fescue and is assumed to be healthy and free of pest and disease problems. The water requirements of crops and plants are calculated from ETo by using crop coefficients (Kc). The following equation is used:
ETo x Kc = crop water requirement
Crop coefficients are different for different crops and varieties. In addition, they change based on the growing stage of the crop. In Texas, crop coefficients have been developed by USDA and Texas A&M AgriLife scientists in the Texas High Plains.
Irrigation Efficiency - To adjust for irrigation system efficiency, we use the following equation:
ETo x Kc / Eff = crop water requirements
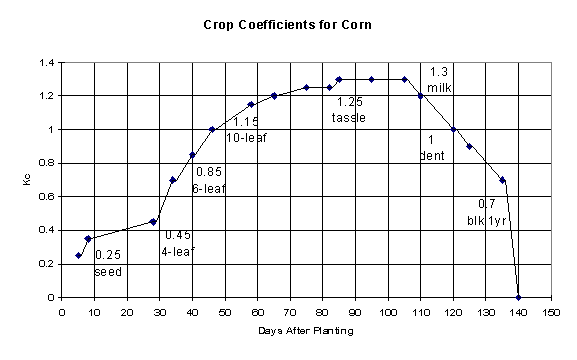
North Plains Crop Coefficient for Corn
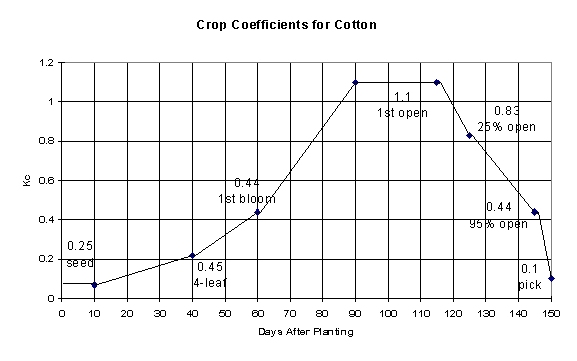
North Plains Crop Coefficients for Cotton
North Plains Crop Coefficients for Peanuts
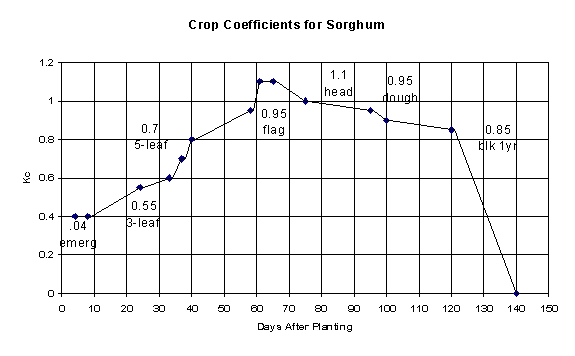
North Plains Crop Coefficients for Sorghum
Potential Evapotranspiration, ETo (also abreviated as PET), is an estimate
of the water requirements of a 4-inch grass growing
in a deep soil under well-watered conditions. A turf
coefficent (Tc) is needed to relate pET to the water
requirements of a specific turf. For established lawns,
the Tc remains constant throughout the active growing
season of the grass. For warm season grasses, such
as St. Augustine, the Tc is 0.6 throughout much of
the year, while the Tc for cool season grasses, such
as rye, is 0.8.
However, we seldomly apply this amount of water to
lawns. Why? Because we do not want maximum production
of grass clippings. Instead, we want to maintain a
healthy, attractive turf with as little water as possible.
Thus, we modify the coefficent by specifying a Quality Factor.
The complete equation is:
ETo x Tc x Qf = turf water requirement
| Warm Season | 0.6 |
| Cool Season | 0.8 |
| No Stress | 1.0 |
| Low Stress | 0.8 |
| Normal Stress | 0.6 |
| High Stress | 0.5 |
| Very High Stress | 0.4 |
| City | Jan | Feb | Mar | Apr | May | Jun | Jul | Aug | Sep | Oct | Nov | Dec |
|---|---|---|---|---|---|---|---|---|---|---|---|---|
| Abilene | 2.08 | 2.57 | 4.14 | 5.48 | 6.47 | 7.65 | 8.36 | 7.46 | 5.48 | 4.21 | 2.67 | 2.08 |
| Amarillo | 1.84 | 2.27 | 3.73 | 5.06 | 5.89 | 7.51 | 8.08 | 7.29 | 5.61 | 4.05 | 2.40 | 1.78 |
| Austin | 2.27 | 2.72 | 4.34 | 5.27 | 6.39 | 7.15 | 7.22 | 7.25 | 5.57 | 4.38 | 2.74 | 2.21 |
| Brownsville | 2.65 | 3.03 | 4.48 | 5.17 | 6.03 | 6.32 | 6.68 | 6.65 | 5.21 | 4.34 | 3.01 | 2.59 |
| College Station | 2.20 | 2.71 | 4.22 | 5.20 | 6.25 | 6.89 | 7.10 | 6.85 | 5.60 | 4.30 | 2.80 | 2.20 |
| Corpus Christi | 2.42 | 2.95 | 4.28 | 5.17 | 5.95 | 6.43 | 6.68 | 6.65 | 5.21 | 4.34 | 3.01 | 2.59 |
| Dallas / Ft Worth | 2.00 | 2.46 | 3.96 | 5.14 | 6.21 | 7.06 | 7.40 | 7.25 | 5.49 | 4.19 | 2.59 | 2.10 |
| Del Rio | 2.47 | 3.01 | 4.76 | 6.01 | 6.98 | 7.41 | 7.57 | 7.41 | 5.77 | 4.35 | 2.91 | 2.36 |
| El Paso | 2.74 | 3.53 | 6.07 | 8.19 | 9.83 | 11.12 | 9.19 | 8.94 | 7.69 | 5.89 | 3.58 | 2.49 |
| Galveston | 2.20 | 2.60 | 4.10 | 5.00 | 6.11 | 6.60 | 6.20 | 6.00 | 5.50 | 4.20 | 2.80 | 2.30 |
| Houston | 2.36 | 2.83 | 4.32 | 5.01 | 6.11 | 6.57 | 6.52 | 6.08 | 5.57 | 4.28 | 2.90 | 2.35 |
| Lubbock | 2.35 | 2.63 | 4.41 | 5.53 | 6.93 | 7.73 | 7.63 | 7.20 | 5.54 | 4.19 | 2.61 | 2.33 |
| Midland | 2.20 | 2.78 | 4.46 | 5.91 | 7.21 | 8.20 | 9.23 | 8.62 | 6.96 | 4.31 | 2.78 | 2.16 |
| Port Arthur | 2.25 | 2.63 | 3.95 | 5.09 | 6.12 | 6.60 | 5.81 | 5.61 | 5.46 | 4.18 | 2.76 | 2.23 |
| San Angelo | 2.88 | 3.13 | 5.31 | 7.01 | 8.48 | 9.16 | 9.29 | 8.49 | 6.60 | 5.08 | 3.37 | 2.54 |
| San Antonio | 2.42 | 2.90 | 4.42 | 5.47 | 6.47 | 6.97 | 7.31 | 6.99 | 5.64 | 4.44 | 2.85 | 2.36 |
| Victoria | 2.35 | 2.87 | 4.29 | 5.77 | 6.39 | 6.70 | 6.92 | 6.70 | 5.36 | 4.41 | 2.93 | 2.33 |
| Waco | 2.13 | 2.62 | 4.03 | 5.31 | 6.45 | 7.15 | 7.40 | 7.50 | 5.70 | 4.41 | 2.70 | 2.17 |
| Wichita Falls | 1.94 | 2.46 | 4.07 | 5.50 | 6.70 | 7.54 | 7.97 | 7.72 | 5.79 | 4.30 | 2.62 | 1.95 |
|
© 2026 Texas A&M AgriLife Extension
|
||||||||||||
| City | Years of Data |
|---|---|
| Abilene |
52
|
| Amarillo |
52
|
| Austin |
70
|
| Brownsville |
79
|
| College Station |
47
|
| Corpus Christi |
52
|
| Dallas/Ft. Worth |
26
|
| Del Rio |
44
|
| El Paso |
52
|
| Galveston |
59
|
| Houston |
31
|
| Lubbock |
89
|
| Midland |
52
|
| Port Arthur |
53
|
| San Angelo |
54
|
| San Antonio |
54
|
| Victoria |
39
|
| Waco |
68
|
| Wichita Falls |
99
|
|
© 2026 Texas A&M AgriLife Extension
|
|
Averages were computed using climatic data over the entire period of record available from the National Weather Service and compared to ETo rates based on the standardized Penman-Monteith equation where available. (August 2005)
| City | Jan | Feb | Mar | Apr | May | Jun | Jul | Aug | Sep | Oct | Nov | Dec | Average |
|---|---|---|---|---|---|---|---|---|---|---|---|---|---|
| Abilene |
55.4
|
60.2
|
68.4
|
77.5
|
84.2
|
91.3
|
94.9
|
94.3 |
87.0
|
77.8
|
65.6
|
57.8
|
76.2
|
| Amarillo |
49.2 |
53.3
|
61.2
|
70.9
|
79.0
|
88.0
|
91.2
|
89.2
|
82.2
|
72.5
|
59.3
|
51.0
|
70.6
|
| Austin |
60.1
|
64.4
|
71.7
|
79.1
|
85.2
|
91.6
|
95.2
|
95.7
|
89.8
|
81.6
|
70.2
|
62.7
|
78.9
|
| Brownsville |
70.3
|
73.1
|
78.0
|
83.2
|
87.4
|
91.3
|
93.0
|
93.6 |
90.4
|
85.1
|
77.9
|
71.6
|
82.9
|
| College Station |
59.3
|
63.6
|
71.0
|
78.4
|
84.8
|
91.2
|
94.7
|
95.3
|
89.4
|
80.9
|
69.9
|
62.2
|
78.4
|
| Corpus Christi |
66.2
|
69.7
|
75.3
|
81.2
|
86.0
|
90.8
|
93.5
|
93.6
|
89.8
|
83.8
|
75.2
|
69.0
|
81.2
|
| Dallas/Ft. Worth |
54.2
|
59.9
|
67.8
|
75.9
|
83.2
|
91.6
|
96.2
|
95.7
|
88.3
|
78.6
|
66.0
|
57.3
|
76.2
|
| Del Rio |
63.4
|
68.2
|
76.1
|
83.6
|
88.8
|
94.4
|
97.0
|
96.7
|
91.0
|
82.1
|
71.6
|
64.3
|
81.4
|
| El Paso |
57.5
|
63.3
|
69.9
|
78.6
|
87.2
|
95.8
|
95.2
|
93.0
|
87.8
|
78.7
|
66.3
|
58.1
|
77.6
|
| Galveston |
59.4
|
61.5
|
67.0
|
73.5
|
80.2
|
85.5
|
87.7
|
88.1
|
85.0
|
78.0
|
69.1
|
62.9
|
74.8
|
| Houston |
61.8
|
66.0
|
72.7
|
79.0
|
85.3
|
90.8
|
93.7
|
93.5
|
89.0
|
81.4
|
71.7
|
64.9
|
79.2
|
| Lubbock |
53.5
|
58.7
|
66.3
|
75.3
|
82.7
|
90.6
|
92.6
|
91.1
|
84.2
|
75.1
|
63.2
|
54.7
|
74.0
|
| Midland |
57.1
|
62.2
|
69.8
|
78.6
|
86.4
|
92.9
|
94.3
|
93.2
|
86.4
|
77.9
|
66.2
|
59.0
|
77.0
|
| Port Arthur |
61.6
|
65.1
|
71.2
|
77.8
|
84.4
|
89.7
|
91.8
|
91.8
|
88.0
|
80.7
|
70.9
|
64.2
|
78.1
|
| San Angelo |
58.4
|
63.2
|
70.8
|
79.7
|
86.3
|
92.2
|
95.5
|
94.6
|
87.6
|
79.1
|
67.6
|
60.5
|
78.0
|
| San Antonio |
61.8
|
66.2
|
73.4
|
80.3
|
86.1
|
91.9
|
95.1
|
95.2
|
89.9
|
82.1
|
71.3
|
64.5
|
79.8
|
| Victoria |
63.3
|
67.1
|
73.8
|
80.4
|
85.7
|
90.8
|
93.7
|
94.0
|
89.6
|
83.0
|
73.7
|
66.3
|
80.1
|
| Waco |
57.1
|
61.9
|
69.4
|
78.0
|
84.6
|
92.1
|
96.4
|
96.8
|
89.9
|
80.6
|
68.1
|
59.9
|
77.9
|
| Wichita Falls |
53.0
|
58.4
|
67.0
|
76.6
|
83.9
|
92.6
|
97.6
|
97.2
|
88.6
|
78.4
|
64.7
|
55.6
|
76.1
|
|
© 2026 Texas A&M AgriLife Extension
|
|||||||||||||
| City | Jan | Feb | Mar | Apr | May | Jun | Jul | Aug | Sep | Oct | Nov | Dec | Average |
|---|---|---|---|---|---|---|---|---|---|---|---|---|---|
| Abilene |
31.6
|
36.1
|
42.9
|
52.3
|
61.0
|
68.8
|
72.5
|
71.5 |
64.7
|
54.3
|
42.3
|
34.2
|
52.7
|
| Amarillo |
21.9 |
26.3
|
32.2
|
41.6
|
51.8
|
61.2
|
65.7
|
64.1
|
56.7
|
44.9
|
32.1
|
24.5
|
43.6
|
| Austin |
39.5
|
43.0
|
49.3
|
57.7
|
65.1
|
71.4
|
73.8
|
73.6
|
68.8
|
59.2
|
48.5
|
41.7
|
57.6
|
| Brownsville |
51.0
|
53.7
|
59.1
|
65.6
|
71.1
|
74.6
|
75.5
|
75.3 |
72.8
|
65.9
|
58.6
|
52.3
|
64.6
|
| College Station |
39.5
|
42.7
|
49.4
|
57.8
|
65.2
|
71.2
|
73.5
|
73.2
|
68.4
|
58.4
|
48.6
|
41.8
|
57.5
|
| Corpus Christi |
46.5
|
49.7
|
55.9
|
63.2
|
69.9
|
73.8
|
75.2
|
75.2
|
72.3
|
64.4
|
55.4
|
49.0
|
62.5
|
| Dallas/Ft. Worth |
34.0
|
38.7
|
46.3
|
54.0
|
63.2
|
70.7
|
74.8
|
74.2
|
67.1
|
56.0
|
45.3
|
36.9
|
55.1
|
| Del Rio |
39.9
|
43.9
|
51.3
|
59.3
|
66.6
|
72.5
|
74.7
|
74.2
|
69.3
|
59.8
|
48.7
|
40.9
|
58.4
|
| El Paso |
31.1
|
35.2
|
41.2
|
49.2
|
57.8
|
66.6
|
69.8
|
68.3
|
62.0
|
50.1
|
38.0
|
31.7
|
50.1
|
| Galveston |
48.1
|
50.6
|
56.8
|
64.6
|
71.9
|
77.3
|
79.4
|
79.1
|
75.6
|
68.2
|
58.1
|
51.6
|
65.1
|
| Houston |
41.3
|
44.3
|
51.1
|
57.8
|
65.5
|
71.3
|
73.2
|
72.8
|
68.4
|
58.7
|
49.7
|
43.5
|
58.1
|
| Lubbock |
25.3
|
29.1
|
35.4
|
45.0
|
54.7
|
63.5
|
66.8
|
65.3
|
58.4
|
47.4
|
35.0
|
27.3
|
46.1
|
| Midland |
29.7
|
33.9
|
40.4
|
49.3
|
58.7
|
66.7
|
69.2
|
68.3
|
61.9
|
51.6
|
38.9
|
31.8
|
50.0
|
| Port Arthur |
42.9
|
45.6
|
51.5
|
59.2
|
66.6
|
72.2
|
74.0
|
73.5
|
69.7
|
59.7
|
50.5
|
44.9
|
59.2
|
| San Angelo |
32.6
|
36.4
|
43.5
|
52.4
|
61.2
|
68.7
|
71.5
|
70.5
|
64.1
|
53.8
|
42.1
|
34.5
|
52.6
|
| San Antonio |
39.4
|
43.0
|
49.9
|
58.1
|
66.0
|
72.1
|
74.4
|
73.8
|
69.2
|
59.5
|
48.5
|
41.6
|
58.0
|
| Victoria |
43.2
|
46.1
|
53.1
|
60.9
|
68.0
|
73.2
|
74.9
|
74.6
|
70.6
|
61.5
|
52.5
|
45.5
|
60.3
|
| Waco |
36.2
|
40.2
|
46.8
|
55.8
|
64.0
|
71.4
|
74.7
|
74.3
|
67.9
|
57.3
|
46.3
|
38.7
|
56.1
|
| Wichita Falls |
29.7
|
34.1
|
41.2
|
50.9
|
59.9
|
68.7
|
72.9
|
72.1
|
64.5
|
53.4
|
40.6
|
32.8
|
51.7
|
|
© 2026 Texas A&M AgriLife Extension
|
|||||||||||||
| City | Jan | Feb | Mar | Apr | May | Jun | Jul | Aug | Sep | Oct | Nov | Dec | Average |
|---|---|---|---|---|---|---|---|---|---|---|---|---|---|
| Abilene |
43.5
|
48.2
|
55.6
|
64.9
|
72.6
|
80.1
|
83.7
|
82.9 |
75.8
|
66.0
|
53.9
|
46.0
|
64.4
|
| Amarillo |
35.6 |
39.8
|
46.7
|
56.3
|
65.4
|
74.6
|
78.5
|
76.7
|
69.4
|
58.7
|
45.7
|
37.8
|
57.1
|
| Austin |
49.8
|
53.7
|
60.5
|
68.4
|
75.2
|
81.5
|
84.5
|
84.6
|
79.3
|
70.4
|
59.4
|
52.2
|
68.3
|
| Brownsville |
60.6
|
63.4
|
68.5
|
74.4
|
79.2
|
82.9
|
84.2
|
84.4 |
81.6
|
75.5
|
68.2
|
62.0
|
73.8
|
| College Station |
49.4
|
53.2
|
60.2
|
68.1
|
75.0
|
81.2
|
84.1
|
84.3
|
78.9
|
69.7
|
59.3
|
52.0
|
67.9
|
| Corpus Christi |
56.4
|
59.7
|
65.6
|
72.2
|
77.8
|
82.3
|
84.3
|
84.4
|
81.1
|
74.1
|
65.3
|
59.0
|
71.8
|
| Dallas/Ft. Worth |
44.1
|
49.3
|
57.1
|
65.0
|
73.2
|
81.1
|
85.5
|
84.9
|
77.7
|
67.3
|
55.7
|
47.1
|
65.7
|
| Del Rio |
51.7
|
56.0
|
63.7
|
71.4
|
77.7
|
83.4
|
85.8
|
85.5
|
80.2
|
70.9
|
60.2
|
52.6
|
69.9
|
| El Paso |
44.3
|
49.3
|
55.6
|
63.9
|
72.5
|
81.2
|
82.5
|
80.7
|
74.9
|
64.4
|
52.2
|
44.9
|
63.9
|
| Galveston |
53.8
|
56.1
|
61.9
|
69.1
|
76.1
|
81.4
|
83.5
|
83.6
|
80.3
|
73.1
|
63.6
|
57.2
|
70.0
|
| Houston |
51.6
|
55.2
|
61.9
|
68.4
|
75.4
|
81.0
|
83.5
|
83.1
|
78.7
|
70.0
|
60.7
|
54.2
|
68.6
|
| Lubbock |
39.4
|
43.9
|
50.9
|
60.2
|
68.7
|
77.0
|
79.7
|
78.2
|
71.3
|
61.2
|
49.1
|
41.0
|
60.1
|
| Midland |
43.4
|
48.0
|
55.1
|
63.9
|
72.5
|
79.8
|
81.8
|
80.7
|
74.2
|
64.7
|
52.6
|
45.4
|
63.5
|
| Port Arthur |
52.2
|
55.4
|
61.4
|
68.5
|
75.5
|
80.9
|
82.9
|
82.6
|
78.8
|
70.2
|
60.7
|
54.6
|
68.6
|
| San Angelo |
45.5
|
49.8
|
57.1
|
66.0
|
73.8
|
80.5
|
83.5
|
82.5
|
75.9
|
66.4
|
54.8
|
47.5
|
65.3
|
| San Antonio |
50.6
|
54.6
|
61.6
|
69.2
|
76.0
|
82.0
|
84.7
|
84.5
|
79.5
|
70.8
|
59.9
|
53.1
|
68.9
|
| Victoria |
53.3
|
56.6
|
63.4
|
70.7
|
76.8
|
82.0
|
84.3
|
84.3
|
80.1
|
72.2
|
63.1
|
55.9
|
70.2
|
| Waco |
46.7
|
51.1
|
58.1
|
66.9
|
74.3
|
81.8
|
85.6
|
85.5
|
78.9
|
68.9
|
57.2
|
49.3
|
67.0
|
| Wichita Falls |
41.4
|
46.3
|
54.1
|
63.7
|
71.9
|
80.7
|
85.2
|
84.6
|
76.6
|
65.9
|
52.6
|
44.2
|
63.9
|
|
© 2026 Texas A&M AgriLife Extension
|
|||||||||||||
| City | Years of Data |
|---|---|
| Abilene |
52
|
| Amarillo |
52
|
| Austin |
70
|
| Brownsville |
79
|
| College Station |
47
|
| Corpus Christi |
52
|
| Dallas/Ft. Worth |
26
|
| Del Rio |
44
|
| El Paso |
52
|
| Galveston |
59
|
| Houston |
31
|
| Lubbock |
89
|
| Midland |
52
|
| Port Arthur |
53
|
| San Angelo |
54
|
| San Antonio |
54
|
| Victoria |
39
|
| Waco |
68
|
| Wichita Falls |
99
|
|
© 2026 Texas A&M AgriLife Extension
|
|
| City | Jan | Feb | Mar | Apr | May | Jun | Jul | Aug | Sep | Oct | Nov | Dec | Average |
|---|---|---|---|---|---|---|---|---|---|---|---|---|---|
| Abilene |
55.4
|
60.2
|
68.4
|
77.5
|
84.2
|
91.3
|
94.9
|
94.3 |
87.0
|
77.8
|
65.6
|
57.8
|
76.2
|
| Amarillo |
49.2 |
53.3
|
61.2
|
70.9
|
79.0
|
88.0
|
91.2
|
89.2
|
82.2
|
72.5
|
59.3
|
51.0
|
70.6
|
| Austin |
60.1
|
64.4
|
71.7
|
79.1
|
85.2
|
91.6
|
95.2
|
95.7
|
89.8
|
81.6
|
70.2
|
62.7
|
78.9
|
| Brownsville |
70.3
|
73.1
|
78.0
|
83.2
|
87.4
|
91.3
|
93.0
|
93.6 |
90.4
|
85.1
|
77.9
|
71.6
|
82.9
|
| College Station |
59.3
|
63.6
|
71.0
|
78.4
|
84.8
|
91.2
|
94.7
|
95.3
|
89.4
|
80.9
|
69.9
|
62.2
|
78.4
|
| Corpus Christi |
66.2
|
69.7
|
75.3
|
81.2
|
86.0
|
90.8
|
93.5
|
93.6
|
89.8
|
83.8
|
75.2
|
69.0
|
81.2
|
| Dallas/Ft. Worth |
54.2
|
59.9
|
67.8
|
75.9
|
83.2
|
91.6
|
96.2
|
95.7
|
88.3
|
78.6
|
66.0
|
57.3
|
76.2
|
| Del Rio |
63.4
|
68.2
|
76.1
|
83.6
|
88.8
|
94.4
|
97.0
|
96.7
|
91.0
|
82.1
|
71.6
|
64.3
|
81.4
|
| El Paso |
57.5
|
63.3
|
69.9
|
78.6
|
87.2
|
95.8
|
95.2
|
93.0
|
87.8
|
78.7
|
66.3
|
58.1
|
77.6
|
| Galveston |
59.4
|
61.5
|
67.0
|
73.5
|
80.2
|
85.5
|
87.7
|
88.1
|
85.0
|
78.0
|
69.1
|
62.9
|
74.8
|
| Houston |
61.8
|
66.0
|
72.7
|
79.0
|
85.3
|
90.8
|
93.7
|
93.5
|
89.0
|
81.4
|
71.7
|
64.9
|
79.2
|
| Lubbock |
53.5
|
58.7
|
66.3
|
75.3
|
82.7
|
90.6
|
92.6
|
91.1
|
84.2
|
75.1
|
63.2
|
54.7
|
74.0
|
| Midland |
57.1
|
62.2
|
69.8
|
78.6
|
86.4
|
92.9
|
94.3
|
93.2
|
86.4
|
77.9
|
66.2
|
59.0
|
77.0
|
| Port Arthur |
61.6
|
65.1
|
71.2
|
77.8
|
84.4
|
89.7
|
91.8
|
91.8
|
88.0
|
80.7
|
70.9
|
64.2
|
78.1
|
| San Angelo |
58.4
|
63.2
|
70.8
|
79.7
|
86.3
|
92.2
|
95.5
|
94.6
|
87.6
|
79.1
|
67.6
|
60.5
|
78.0
|
| San Antonio |
61.8
|
66.2
|
73.4
|
80.3
|
86.1
|
91.9
|
95.1
|
95.2
|
89.9
|
82.1
|
71.3
|
64.5
|
79.8
|
| Victoria |
63.3
|
67.1
|
73.8
|
80.4
|
85.7
|
90.8
|
93.7
|
94.0
|
89.6
|
83.0
|
73.7
|
66.3
|
80.1
|
| Waco |
57.1
|
61.9
|
69.4
|
78.0
|
84.6
|
92.1
|
96.4
|
96.8
|
89.9
|
80.6
|
68.1
|
59.9
|
77.9
|
| Wichita Falls |
53.0
|
58.4
|
67.0
|
76.6
|
83.9
|
92.6
|
97.6
|
97.2
|
88.6
|
78.4
|
64.7
|
55.6
|
76.1
|
|
© 2026 Texas A&M AgriLife Extension
|
|||||||||||||
| City | Jan | Feb | Mar | Apr | May | Jun | Jul | Aug | Sep | Oct | Nov | Dec | Average |
|---|---|---|---|---|---|---|---|---|---|---|---|---|---|
| Abilene |
31.6
|
36.1
|
42.9
|
52.3
|
61.0
|
68.8
|
72.5
|
71.5 |
64.7
|
54.3
|
42.3
|
34.2
|
52.7
|
| Amarillo |
21.9 |
26.3
|
32.2
|
41.6
|
51.8
|
61.2
|
65.7
|
64.1
|
56.7
|
44.9
|
32.1
|
24.5
|
43.6
|
| Austin |
39.5
|
43.0
|
49.3
|
57.7
|
65.1
|
71.4
|
73.8
|
73.6
|
68.8
|
59.2
|
48.5
|
41.7
|
57.6
|
| Brownsville |
51.0
|
53.7
|
59.1
|
65.6
|
71.1
|
74.6
|
75.5
|
75.3 |
72.8
|
65.9
|
58.6
|
52.3
|
64.6
|
| College Station |
39.5
|
42.7
|
49.4
|
57.8
|
65.2
|
71.2
|
73.5
|
73.2
|
68.4
|
58.4
|
48.6
|
41.8
|
57.5
|
| Corpus Christi |
46.5
|
49.7
|
55.9
|
63.2
|
69.9
|
73.8
|
75.2
|
75.2
|
72.3
|
64.4
|
55.4
|
49.0
|
62.5
|
| Dallas/Ft. Worth |
34.0
|
38.7
|
46.3
|
54.0
|
63.2
|
70.7
|
74.8
|
74.2
|
67.1
|
56.0
|
45.3
|
36.9
|
55.1
|
| Del Rio |
39.9
|
43.9
|
51.3
|
59.3
|
66.6
|
72.5
|
74.7
|
74.2
|
69.3
|
59.8
|
48.7
|
40.9
|
58.4
|
| El Paso |
31.1
|
35.2
|
41.2
|
49.2
|
57.8
|
66.6
|
69.8
|
68.3
|
62.0
|
50.1
|
38.0
|
31.7
|
50.1
|
| Galveston |
48.1
|
50.6
|
56.8
|
64.6
|
71.9
|
77.3
|
79.4
|
79.1
|
75.6
|
68.2
|
58.1
|
51.6
|
65.1
|
| Houston |
41.3
|
44.3
|
51.1
|
57.8
|
65.5
|
71.3
|
73.2
|
72.8
|
68.4
|
58.7
|
49.7
|
43.5
|
58.1
|
| Lubbock |
25.3
|
29.1
|
35.4
|
45.0
|
54.7
|
63.5
|
66.8
|
65.3
|
58.4
|
47.4
|
35.0
|
27.3
|
46.1
|
| Midland |
29.7
|
33.9
|
40.4
|
49.3
|
58.7
|
66.7
|
69.2
|
68.3
|
61.9
|
51.6
|
38.9
|
31.8
|
50.0
|
| Port Arthur |
42.9
|
45.6
|
51.5
|
59.2
|
66.6
|
72.2
|
74.0
|
73.5
|
69.7
|
59.7
|
50.5
|
44.9
|
59.2
|
| San Angelo |
32.6
|
36.4
|
43.5
|
52.4
|
61.2
|
68.7
|
71.5
|
70.5
|
64.1
|
53.8
|
42.1
|
34.5
|
52.6
|
| San Antonio |
39.4
|
43.0
|
49.9
|
58.1
|
66.0
|
72.1
|
74.4
|
73.8
|
69.2
|
59.5
|
48.5
|
41.6
|
58.0
|
| Victoria |
43.2
|
46.1
|
53.1
|
60.9
|
68.0
|
73.2
|
74.9
|
74.6
|
70.6
|
61.5
|
52.5
|
45.5
|
60.3
|
| Waco |
36.2
|
40.2
|
46.8
|
55.8
|
64.0
|
71.4
|
74.7
|
74.3
|
67.9
|
57.3
|
46.3
|
38.7
|
56.1
|
| Wichita Falls |
29.7
|
34.1
|
41.2
|
50.9
|
59.9
|
68.7
|
72.9
|
72.1
|
64.5
|
53.4
|
40.6
|
32.8
|
51.7
|
|
© 2026 Texas A&M AgriLife Extension
|
|||||||||||||
| City | Jan | Feb | Mar | Apr | May | Jun | Jul | Aug | Sep | Oct | Nov | Dec | Average |
|---|---|---|---|---|---|---|---|---|---|---|---|---|---|
| Abilene |
43.5
|
48.2
|
55.6
|
64.9
|
72.6
|
80.1
|
83.7
|
82.9 |
75.8
|
66.0
|
53.9
|
46.0
|
64.4
|
| Amarillo |
35.6 |
39.8
|
46.7
|
56.3
|
65.4
|
74.6
|
78.5
|
76.7
|
69.4
|
58.7
|
45.7
|
37.8
|
57.1
|
| Austin |
49.8
|
53.7
|
60.5
|
68.4
|
75.2
|
81.5
|
84.5
|
84.6
|
79.3
|
70.4
|
59.4
|
52.2
|
68.3
|
| Brownsville |
60.6
|
63.4
|
68.5
|
74.4
|
79.2
|
82.9
|
84.2
|
84.4 |
81.6
|
75.5
|
68.2
|
62.0
|
73.8
|
| College Station |
49.4
|
53.2
|
60.2
|
68.1
|
75.0
|
81.2
|
84.1
|
84.3
|
78.9
|
69.7
|
59.3
|
52.0
|
67.9
|
| Corpus Christi |
56.4
|
59.7
|
65.6
|
72.2
|
77.8
|
82.3
|
84.3
|
84.4
|
81.1
|
74.1
|
65.3
|
59.0
|
71.8
|
| Dallas/Ft. Worth |
44.1
|
49.3
|
57.1
|
65.0
|
73.2
|
81.1
|
85.5
|
84.9
|
77.7
|
67.3
|
55.7
|
47.1
|
65.7
|
| Del Rio |
51.7
|
56.0
|
63.7
|
71.4
|
77.7
|
83.4
|
85.8
|
85.5
|
80.2
|
70.9
|
60.2
|
52.6
|
69.9
|
| El Paso |
44.3
|
49.3
|
55.6
|
63.9
|
72.5
|
81.2
|
82.5
|
80.7
|
74.9
|
64.4
|
52.2
|
44.9
|
63.9
|
| Galveston |
53.8
|
56.1
|
61.9
|
69.1
|
76.1
|
81.4
|
83.5
|
83.6
|
80.3
|
73.1
|
63.6
|
57.2
|
70.0
|
| Houston |
51.6
|
55.2
|
61.9
|
68.4
|
75.4
|
81.0
|
83.5
|
83.1
|
78.7
|
70.0
|
60.7
|
54.2
|
68.6
|
| Lubbock |
39.4
|
43.9
|
50.9
|
60.2
|
68.7
|
77.0
|
79.7
|
78.2
|
71.3
|
61.2
|
49.1
|
41.0
|
60.1
|
| Midland |
43.4
|
48.0
|
55.1
|
63.9
|
72.5
|
79.8
|
81.8
|
80.7
|
74.2
|
64.7
|
52.6
|
45.4
|
63.5
|
| Port Arthur |
52.2
|
55.4
|
61.4
|
68.5
|
75.5
|
80.9
|
82.9
|
82.6
|
78.8
|
70.2
|
60.7
|
54.6
|
68.6
|
| San Angelo |
45.5
|
49.8
|
57.1
|
66.0
|
73.8
|
80.5
|
83.5
|
82.5
|
75.9
|
66.4
|
54.8
|
47.5
|
65.3
|
| San Antonio |
50.6
|
54.6
|
61.6
|
69.2
|
76.0
|
82.0
|
84.7
|
84.5
|
79.5
|
70.8
|
59.9
|
53.1
|
68.9
|
| Victoria |
53.3
|
56.6
|
63.4
|
70.7
|
76.8
|
82.0
|
84.3
|
84.3
|
80.1
|
72.2
|
63.1
|
55.9
|
70.2
|
| Waco |
46.7
|
51.1
|
58.1
|
66.9
|
74.3
|
81.8
|
85.6
|
85.5
|
78.9
|
68.9
|
57.2
|
49.3
|
67.0
|
| Wichita Falls |
41.4
|
46.3
|
54.1
|
63.7
|
71.9
|
80.7
|
85.2
|
84.6
|
76.6
|
65.9
|
52.6
|
44.2
|
63.9
|
|
© 2026 Texas A&M AgriLife Extension
|
|||||||||||||
| City | Years of Data |
|---|---|
| Abilene |
52
|
| Amarillo |
52
|
| Austin |
70
|
| Brownsville |
79
|
| College Station |
47
|
| Corpus Christi |
52
|
| Dallas/Ft. Worth |
26
|
| Del Rio |
44
|
| El Paso |
52
|
| Galveston |
59
|
| Houston |
31
|
| Lubbock |
89
|
| Midland |
52
|
| Port Arthur |
53
|
| San Angelo |
54
|
| San Antonio |
54
|
| Victoria |
39
|
| Waco |
68
|
| Wichita Falls |
99
|
|
© 2026 Texas A&M AgriLife Extension
|
|
| City | Jan | Feb | Mar | Apr | May | Jun | Jul | Aug | Sep | Oct | Nov | Dec |
|---|---|---|---|---|---|---|---|---|---|---|---|---|
| Amarillo | 0.59 | 0.58 | 0.93 | 1.24 | 2.74 | 3.40 | 2.88 | 2.99 | 1.89 | 1.41 | 0.62 | 0.57 |
| Austin | 2.11 | 2.41 | 2.05 | 3.01 | 4.38 | 3.46 | 2.05 | 2.23 | 3.38 | 3.35 | 2.28 | 2.46 |
| Brownsville | 1.33 | 1.31 | 0.90 | 1.63 | 2.31 | 2.85 | 1.69 | 2.46 | 4.95 | 3.36 | 1.61 | 1.18 |
| College Station | 2.87 | 2.88 | 2.50 | 3.77 | 4.73 | 3.79 | 2.24 | 2.43 | 4.30 | 3.64 | 3.07 | 3.15 |
| Corpus Christi | 1.57 | 1.88 | 1.33 | 2.06 | 3.09 | 3.19 | 1.84 | 3.33 | 5.30 | 3.54 | 1.56 | 1.60 |
| Dallas / Ft Worth | 1.94 | 2.44 | 3.12 | 3.15 | 5.43 | 3.18 | 2.09 | 2.10 | 2.42 | 4.01 | 2.43 | 2.50 |
| Del Rio | 0.53 | 0.91 | 0.86 | 1.89 | 2.39 | 1.90 | 1.54 | 1.72 | 2.59 | 1.94 | 0.85 | 0.65 |
| El Paso | 0.42 | 0.41 | 0.30 | 0.21 | 0.33 | 0.72 | 1.56 | 1.48 | 1.42 | 0.72 | 0.35 | 0.62 |
| Galveston | 3.33 | 2.58 | 2.43 | 2.55 | 3.46 | 4.14 | 3.77 | 4.23 | 5.36 | 3.17 | 3.33 | 3.59 |
| Houston | 3.70 | 2.99 | 3.48 | 3.49 | 5.22 | 5.13 | 3.25 | 3.79 | 4.45 | 4.65 | 3.89 | 3.64 |
| Lubbock | 0.52 | 0.61 | 0.82 | 1.26 | 2.62 | 2.67 | 2.12 | 2.07 | 2.53 | 1.99 | 0.62 | 0.64 |
| Midland | 0.54 | 0.61 | 0.47 | 0.77 | 2.02 | 1.59 | 1.83 | 1.65 | 2.04 | 1.56 | 0.58 | 0.53 |
| Port Arthur | 4.86 | 3.96 | 3.30 | 3.86 | 5.02 | 5.68 | 5.31 | 5.04 | 5.77 | 4.20 | 4.22 | 5.13 |
| San Angelo | 0.83 | 1.05 | 0.93 | 1.68 | 2.86 | 2.20 | 1.16 | 1.77 | 2.78 | 2.21 | 0.96 | 0.78 |
| San Antonio | 1.61 | 1.90 | 1.68 | 2.53 | 3.99 | 3.57 | 1.83 | 2.58 | 3.29 | 3.29 | 2.11 | 1.72 |
| Victoria | 2.28 | 2.12 | 2.08 | 2.93 | 4.95 | 4.77 | 3.03 | 3.08 | 5.37 | 3.72 | 2.51 | 2.33 |
| Waco | 2.07 | 2.39 | 2.51 | 3.43 | 4.59 | 2.80 | 1.88 | 1.66 | 3.07 | 2.91 | 2.48 | 2.49 |
| Wichita Falls | 1.08 | 1.31 | 1.91 | 2.72 | 4.59 | 3.36 | 2.05 | 2.16 | 2.94 | 2.69 | 1.55 | 1.56 |
| Abilene | 1.01 | 1.10 | 1.19 | 2.09 | 3.31 | 2.90 | 2.09 | 2.45 | 2.75 | 2.48 | 1.28 | 1.04 |
|
© 2026 Texas A&M AgriLife Extension
|
||||||||||||
| City | Years of Data |
|---|---|
| Abilene |
52
|
| Amarillo |
52
|
| Austin |
70
|
| Brownsville |
79
|
| College Station |
47
|
| Corpus Christi |
52
|
| Dallas/Ft. Worth |
26
|
| Del Rio |
44
|
| El Paso |
52
|
| Galveston |
59
|
| Houston |
31
|
| Lubbock |
89
|
| Midland |
52
|
| Port Arthur |
53
|
| San Angelo |
54
|
| San Antonio |
54
|
| Victoria |
39
|
| Waco |
68
|
| Wichita Falls |
99
|
|
© 2026 Texas A&M AgriLife Extension
|
|
| Station | Status | Data Available | Last Error Message | Date Error Occurred |
|---|---|---|---|---|
| Abilene | Updated | 01/05/2024 - 01/24/2026 | Soil temperature data out of range:-14366.2 | 02/26/2025 |
| Allen | Not Updated | 03/06/2015 - 01/23/2026 | No Error Logged | |
| Alvarado | Updated | 07/08/2020 - 01/24/2026 | Solar radiation data out of range:-7.1991 | 09/06/2023 |
| Argyle | Not Updated | 05/26/2018 - 01/23/2026 | Solar radiation data out of range:-7999 | 08/19/2025 |
| Aubrey | Updated | 04/20/2022 - 01/24/2026 | Solar radiation data out of range:-7.1991 | 06/22/2025 |
| Austin (LCRA Redbud) | Updated | 09/11/2014 - 01/24/2026 | Solar radiation data out of range:0 | 06/26/2022 |
| Ballinger | Updated | 12/17/2020 - 01/24/2026 | Solar radiation data out of range:-7.1991 | 12/24/2025 |
| Ben Wheeler | Updated | 04/20/2022 - 01/24/2026 | Solar radiation data out of range:-7.1991 | 09/12/2025 |
| Bryan | Not Updated | 08/05/2014 - 01/22/2026 | Solar radiation data out of range:-7999 | 09/06/2025 |
| Buda | Updated | 08/08/2018 - 01/24/2026 | Temperature data out of range:195.65 | 09/04/2025 |
| Burnet | Updated | 07/26/2017 - 01/24/2026 | Solar radiation data out of range:0 | 06/28/2022 |
| Canyon | Not Updated | 12/09/2022 - 01/23/2026 | Solar radiation data out of range:-7999 | 09/05/2025 |
| Carthage | Updated | 12/10/2020 - 01/24/2026 | Temperature data out of range:-304.24 | 10/09/2024 |
| Cash | Not Updated | 04/01/2016 - 12/21/2025 | Solar radiation data out of range:-7999 | 01/29/2024 |
| Cedar Creek | Updated | 12/13/2020 - 01/24/2026 | Solar radiation data out of range:0 | 06/28/2022 |
| Cedar Park | Updated | 02/11/2015 - 01/24/2026 | Solar radiation data out of range:0 | 06/26/2022 |
| Celina | Not Updated | 06/24/2025 - 01/23/2026 | No Error Logged | |
| Conroe | Not Updated | 09/05/2013 - 01/19/2026 | Relative humidity data out of range:7999 | 05/14/2025 |
| Cooper | Updated | 09/17/2025 - 01/24/2026 | No Error Logged | |
| Corpus Christi AgriLife | Not Updated | 06/08/2022 - 01/23/2026 | Wind speed data out of range:873.040939162996 | 01/21/2025 |
| Corpus Christi North | Not Updated | 08/15/2023 - 01/23/2026 | Solar radiation data out of range:-7999 | 09/25/2025 |
| Corpus Christi South | Not Updated | 08/15/2023 - 01/23/2026 | Solar radiation data out of range:-7999 | 08/15/2025 |
| Crystal City | Updated | 03/29/2024 - 01/24/2026 | No Error Logged | |
| Dallas AgriLife Center | Not Updated | 04/07/2008 - 01/16/2026 | Temperature data out of range:137.786 | 08/22/2025 |
| Delta Lake | Updated | 03/13/2019 - 01/24/2026 | Solar radiation data out of range:-7999 | 10/23/2025 |
| Detroit | Not Updated | 01/05/2024 - 12/23/2025 | Soil temperature data out of range:-14366.2 | 02/26/2025 |
| Dickinson | Not Updated | 07/27/2016 - 01/23/2026 | Solar radiation data out of range:-7999 | 05/09/2025 |
| Dime Box | Updated | 12/03/2024 - 01/24/2026 | No Error Logged | |
| Dripping Springs | Updated | 02/11/2015 - 01/24/2026 | Solar radiation data out of range:0 | 06/28/2022 |
| Driscoll | Not Updated | 06/07/2022 - 11/26/2025 | No Error Logged | |
| Eagle Pass | Updated | 04/03/2025 - 01/24/2026 | No Error Logged | |
| El Dorado | Not Updated | 02/06/2025 - 12/23/2025 | Solar radiation data out of range:-7.1991 | 07/06/2025 |
| Fabens | Updated | 04/20/2022 - 01/24/2026 | Solar radiation data out of range:0 | 06/28/2022 |
| Farmersville | Not Updated | 11/15/2012 - 01/22/2026 | Solar radiation data out of range:0 | 06/29/2022 |
| Forestburg | Updated | 12/13/2020 - 01/24/2026 | Solar radiation data out of range:0 | 06/28/2022 |
| Forney | Not Updated | 12/03/2012 - 01/23/2026 | No Error Logged | |
| Fort Stockton East | Not Updated | 07/08/2020 - 12/23/2025 | Solar radiation data out of range:-7.1991 | 08/06/2025 |
| Fort Stockton West | Updated | 12/10/2020 - 01/24/2026 | Solar radiation data out of range:-7.1991 | 09/18/2024 |
| Fort Worth - NOAA | Updated | 08/25/2011 - 01/24/2026 | Solar radiation data out of range:-0.0002808 | 07/11/2022 |
| Freer | Updated | 04/20/2022 - 01/24/2026 | Solar radiation data out of range:0 | 06/28/2022 |
| Garland | Not Updated | 03/07/2015 - 01/23/2026 | Solar radiation data out of range:0 | 06/28/2022 |
| Garwood | Updated | 12/10/2020 - 01/24/2026 | Solar radiation data out of range:-7.1991 | 04/08/2025 |
| Goliad | Not Updated | 12/13/2020 - 04/24/2025 | Solar radiation data out of range:0 | 06/28/2022 |
| Halfway | Not Updated | 06/28/2012 - 01/23/2026 | Solar radiation data out of range:-28.7964 | 04/08/2024 |
| Hebbronville | Updated | 04/20/2022 - 01/24/2026 | Solar radiation data out of range:-7.1991 | 08/17/2022 |
| Highland-University Park | Not Updated | 04/19/2016 - 01/23/2026 | Relative humidity data out of range:0 | 12/26/2025 |
| Houston | Not Updated | 07/27/2016 - 01/23/2026 | Solar radiation data out of range:-7999 | 04/29/2023 |
| Houston North | Not Updated | 07/11/2023 - 01/19/2026 | Solar radiation data out of range:-7999 | 07/20/2025 |
| Huntsville | Not Updated | 01/22/2010 - 01/23/2026 | Relative humidity data out of range:110 | 07/24/2025 |
| Irving North | Not Updated | 10/08/2013 - 01/23/2026 | Solar radiation data out of range:-7999 | 05/12/2025 |
| Irving South | Not Updated | 10/08/2013 - 01/23/2026 | Solar radiation data out of range:-7999 | 10/03/2023 |
| Jersey Village | Not Updated | 03/06/2020 - 01/19/2026 | Solar radiation data out of range:-7999 | 07/17/2025 |
| Kennedale | Not Updated | 11/12/2014 - 04/02/2025 | Solar radiation data out of range:-7.2E-05 | 07/11/2022 |
| Kingsville | Updated | 12/20/2020 - 01/24/2026 | Temperature data out of range:-262.84 | 11/27/2023 |
| La Gloria | Not Updated | 07/08/2020 - 12/23/2025 | Temperature data out of range:-38.542 | 09/02/2024 |
| La Villa | Updated | 12/10/2020 - 01/24/2026 | Solar radiation data out of range:0 | 06/28/2022 |
| Ladonia 2 | Updated | 06/17/2025 - 01/24/2026 | No Error Logged | |
| Lakeway | Updated | 02/11/2015 - 01/24/2026 | Solar radiation data out of range:0 | 06/26/2022 |
| Lewisville | Not Updated | 06/26/2015 - 01/23/2026 | Solar radiation data out of range:-7999 | 02/15/2024 |
| Lubbock | Not Updated | 06/02/2020 - 01/23/2026 | Solar radiation data out of range:-7999 | 07/03/2025 |
| Marble Falls | Updated | 09/11/2014 - 01/24/2026 | Solar radiation data out of range:0 | 06/28/2022 |
| Marfa | Updated | 04/20/2022 - 01/24/2026 | Solar radiation data out of range:-7.1991 | 10/19/2024 |
| McKinney | Not Updated | 11/15/2012 - 01/23/2026 | Temperature data out of range:-46.09 | 04/20/2023 |
| Medina | Updated | 05/25/2021 - 01/24/2026 | Solar radiation data out of range:0 | 06/28/2022 |
| Melissa | Not Updated | 03/16/2016 - 02/12/2024 | Solar radiation data out of range:0 | 06/12/2022 |
| Melissa RD121 | Not Updated | 04/01/2016 - 12/08/2025 | Solar radiation data out of range:0 | 06/25/2022 |
| Memorial Village | Not Updated | 09/14/2017 - 01/22/2026 | Solar radiation data out of range:0 | 06/27/2022 |
| Menard | Updated | 07/08/2020 - 01/24/2026 | Solar radiation data out of range:-7.1991 | 02/14/2024 |
| Mesquite | Not Updated | 12/03/2012 - 01/23/2026 | Solar radiation data out of range:0 | 06/27/2022 |
| Mountain Home | Updated | 12/03/2024 - 01/24/2026 | No Error Logged | |
| Murphy | Not Updated | 03/16/2016 - 08/19/2024 | Solar radiation data out of range:-7999 | 06/05/2025 |
| Naples | Updated | 04/20/2022 - 01/24/2026 | Solar radiation data out of range:-7.1991 | 11/18/2025 |
| Nasho | Updated | 07/05/2018 - 01/24/2026 | Solar radiation data out of range:-7999 | 11/15/2024 |
| Nocona | Updated | 12/10/2020 - 01/24/2026 | Solar radiation data out of range:0 | 06/28/2022 |
| Overton | Not Updated | 06/07/2004 - 01/22/2026 | Solar radiation data out of range:-7999 | 04/28/2025 |
| Ozona-Sonora | Updated | 07/08/2020 - 01/24/2026 | Solar radiation data out of range:-7.1991 | 08/26/2025 |
| Pflugerville | Updated | 02/11/2015 - 01/24/2026 | Solar radiation data out of range:0 | 06/27/2022 |
| Plano | Not Updated | 11/15/2012 - 01/06/2025 | Solar radiation data out of range:0 | 06/29/2022 |
| Princeton | Not Updated | 03/07/2015 - 01/23/2026 | Solar radiation data out of range:0 | 06/24/2022 |
| Prosper | Not Updated | 07/21/2021 - 01/23/2026 | Solar radiation data out of range:-7999 | 07/14/2025 |
| Providence Village | Not Updated | 06/26/2015 - 01/23/2026 | Solar radiation data out of range:-7999 | 04/18/2024 |
| Refugio | Updated | 12/22/2020 - 01/24/2026 | Solar radiation data out of range:-7.1991 | 02/18/2025 |
| Richardson | Not Updated | 03/06/2015 - 01/23/2026 | Solar radiation data out of range:0 | 06/27/2022 |
| Richmond North | Not Updated | 01/01/2018 - 01/23/2026 | Solar radiation data out of range:-7999 | 04/24/2024 |
| Richmond South | Not Updated | 07/27/2016 - 01/23/2026 | Solar radiation data out of range:-7999 | 05/14/2023 |
| Rockwall | Not Updated | 12/03/2012 - 01/23/2026 | Solar radiation data out of range:0 | 06/29/2022 |
| Round Rock | Updated | 12/17/2020 - 01/24/2026 | Solar radiation data out of range:0 | 06/28/2022 |
| Royse City | Not Updated | 03/07/2015 - 01/23/2026 | Solar radiation data out of range:0 | 06/25/2022 |
| Sachse | Not Updated | 03/23/2016 - 12/03/2025 | No Error Logged | |
| San Angelo | Not Updated | 11/03/2016 - 12/25/2022 | Solar radiation data out of range:0 | 06/29/2022 |
| San Antonio North | Not Updated | 09/02/2005 - 01/23/2026 | Solar radiation data out of range:-7999 | 06/11/2025 |
| San Benito | Updated | 04/20/2022 - 01/24/2026 | Solar radiation data out of range:-7.1991 | 11/27/2023 |
| San Saba | Updated | 12/13/2020 - 01/24/2026 | Solar radiation data out of range:-7.1991 | 09/06/2024 |
| Schleicher County North | Not Updated | 04/20/2022 - 08/16/2023 | Relative humidity data out of range:0 | 11/22/2026 |
| Seagoville | Not Updated | 01/21/2016 - 01/23/2026 | Solar radiation data out of range:0 | 06/27/2022 |
| Seguin | Not Updated | 12/10/2020 - 12/23/2025 | Solar radiation data out of range:0 | 06/28/2022 |
| Shafter | Updated | 04/20/2022 - 01/24/2026 | Solar radiation data out of range:-7.1991 | 08/09/2022 |
| Sinton | Updated | 07/08/2020 - 01/24/2026 | Temperature data out of range:-27.886 | 02/23/2023 |
| Southlake | Updated | 10/16/2015 - 01/24/2026 | Wind speed data out of range:131.988 | 09/05/2025 |
| Spicewood | Updated | 07/26/2017 - 01/24/2026 | Solar radiation data out of range:0 | 06/28/2022 |
| Spring | Not Updated | 09/01/2016 - 01/23/2026 | Solar radiation data out of range:-7999 | 04/06/2025 |
| Springtown | Not Updated | 07/08/2020 - 12/23/2025 | Solar radiation data out of range:-7.1991 | 10/16/2025 |
| TAMU Irrigation Lab | Updated | 04/07/2021 - 01/24/2026 | Temperature data out of range:-124.3 | 04/13/2023 |
| TAMU Turf Lab | Not Updated | 11/08/2012 - 01/23/2026 | Temperature data out of range:-74.88 | 01/03/2023 |
| Tarrant West | Updated | 11/12/2014 - 01/24/2026 | Solar radiation data out of range:-0.208476 | 09/18/2025 |
| Tawakoni | Not Updated | 01/21/2016 - 01/23/2026 | Solar radiation data out of range:0 | 06/27/2022 |
| Uvalde Research | Not Updated | 11/06/2010 - 01/23/2026 | Solar radiation data out of range:0 | 06/23/2022 |
| Van Horn North | Updated | 12/10/2020 - 01/24/2026 | Solar radiation data out of range:-7.1991 | 03/23/2024 |
| Van Horn South | Updated | 07/08/2020 - 01/24/2026 | Temperature data out of range:-14366.2 | 10/24/2023 |
| Victoria County West | Updated | 04/20/2022 - 01/24/2026 | Solar radiation data out of range:-7.1991 | 07/11/2025 |
| Waco | Not Updated | 02/14/2012 - 04/29/2025 | Temperature data out of range:-39.29 | 04/24/2025 |
| Washington | Not Updated | 04/20/2022 - 10/02/2023 | Solar radiation data out of range:-7.1991 | 09/17/2023 |
| Water Valley | Updated | 04/02/2024 - 01/24/2026 | Solar radiation data out of range:-7.1991 | 01/29/2025 |
| Wylie | Not Updated | 11/13/2012 - 01/23/2026 | Solar radiation data out of range:0 | 06/21/2022 |
|
| Station | Status | Data Available | Last Error Message | Date Error Occurred | Total Rainfall |
|---|---|---|---|---|---|
| Allen Rain | Not Updated | 01/20/2016 - 12/23/2025 | No Error Logged | 0 | |
| Baytown Rain (77520) | Not Updated | 01/01/0001 - 01/01/0001 | No Error Logged | 0 | |
| Baytown Rain (77521) | Not Updated | 06/01/2021 - 12/23/2025 | No Error Logged | 0 | |
| Brookshire Rain (77423) | Not Updated | 06/01/2021 - 12/23/2025 | No Error Logged | 0 | |
| Channelview Rain (77530) | Not Updated | 06/01/2021 - 12/23/2025 | No Error Logged | 0 | |
| Conroe Rain (77306) | Not Updated | 06/01/2021 - 12/23/2025 | No Error Logged | 0 | |
| Crosby Rain (77532) | Not Updated | 06/01/2021 - 12/23/2025 | No Error Logged | 0 | |
| Cypress Rain (77429) | Not Updated | 06/01/2021 - 12/06/2025 | No Error Logged | 0 | |
| Cypress Rain (77433) | Not Updated | 06/01/2021 - 12/06/2025 | No Error Logged | 0 | |
| Farmersville Rain | Not Updated | 01/20/2016 - 05/21/2025 | No Error Logged | 0 | |
| Forney Rain | Not Updated | 01/20/2016 - 12/22/2025 | No Error Logged | 0 | |
| Friendswood Rain (77546) | Not Updated | 06/01/2021 - 12/23/2025 | No Error Logged | 0 | |
| Garland Rain | Not Updated | 01/20/2016 - 12/23/2025 | No Error Logged | 0 | |
| Hockley Rain (77447) | Not Updated | 06/01/2021 - 12/06/2025 | No Error Logged | 0 | |
| Houston Rain (77007) | Not Updated | 05/14/2021 - 12/23/2025 | No Error Logged | 0 | |
| Houston Rain (77008) | Not Updated | 01/01/0001 - 01/01/0001 | No Error Logged | 0 | |
| Houston Rain (77013) | Not Updated | 05/28/2021 - 12/23/2025 | No Error Logged | 0 | |
| Houston Rain (77014) | Not Updated | 05/28/2021 - 12/23/2025 | No Error Logged | 0 | |
| Houston Rain (77015) | Not Updated | 05/28/2021 - 12/23/2025 | No Error Logged | 0 | |
| Houston Rain (77017) | Not Updated | 05/28/2021 - 12/23/2025 | No Error Logged | 0 | |
| Houston Rain (77018) | Not Updated | 05/28/2021 - 12/06/2025 | No Error Logged | 0 | |
| Houston Rain (77019) | Not Updated | 05/28/2021 - 12/23/2025 | No Error Logged | 0 | |
| Houston Rain (77023) | Not Updated | 05/28/2021 - 12/23/2025 | No Error Logged | 0 | |
| Houston Rain (77025) | Not Updated | 05/28/2021 - 12/23/2025 | No Error Logged | 0 | |
| Houston Rain (77029) | Not Updated | 06/01/2021 - 12/23/2025 | No Error Logged | 0 | |
| Houston Rain (77031) | Not Updated | 05/28/2021 - 12/23/2025 | No Error Logged | 0 | |
| Houston Rain (77032) | Not Updated | 05/28/2021 - 12/23/2025 | No Error Logged | 0 | |
| Houston Rain (77035) | Not Updated | 06/01/2021 - 12/23/2025 | No Error Logged | 0 | |
| Houston Rain (77036) | Not Updated | 05/28/2021 - 12/23/2025 | No Error Logged | 0 | |
| Houston Rain (77037) | Not Updated | 05/28/2021 - 12/23/2025 | No Error Logged | 0 | |
| Houston Rain (77039) | Not Updated | 06/01/2021 - 12/23/2025 | No Error Logged | 0 | |
| Houston Rain (77040) | Not Updated | 06/01/2021 - 12/06/2025 | No Error Logged | 0 | |
| Houston Rain (77042) | Not Updated | 05/28/2021 - 12/23/2025 | No Error Logged | 0 | |
| Houston Rain (77044) | Not Updated | 06/01/2021 - 12/23/2025 | No Error Logged | 0 | |
| Houston Rain (77045) | Not Updated | 05/28/2021 - 12/23/2025 | No Error Logged | 0 | |
| Houston Rain (77047) | Not Updated | 05/28/2021 - 12/23/2025 | No Error Logged | 0 | |
| Houston Rain (77048) | Not Updated | 05/28/2021 - 12/23/2025 | No Error Logged | 0 | |
| Houston Rain (77049) | Not Updated | 06/01/2021 - 12/23/2025 | No Error Logged | 0 | |
| Houston Rain (77051) | Not Updated | 05/28/2021 - 12/23/2025 | No Error Logged | 0 | |
| Houston Rain (77054) | Not Updated | 05/28/2021 - 12/23/2025 | No Error Logged | 0 | |
| Houston Rain (77055) | Not Updated | 06/01/2021 - 12/23/2025 | No Error Logged | 0 | |
| Houston Rain (77058) | Not Updated | 06/01/2021 - 12/23/2025 | No Error Logged | 0 | |
| Houston Rain (77059) | Not Updated | 05/28/2021 - 12/23/2025 | No Error Logged | 0 | |
| Houston Rain (77060) | Not Updated | 05/28/2021 - 12/23/2025 | No Error Logged | 0 | |
| Houston Rain (77063) | Not Updated | 06/01/2021 - 12/23/2025 | No Error Logged | 0 | |
| Houston Rain (77064) | Not Updated | 05/28/2021 - 12/06/2025 | No Error Logged | 0 | |
| Houston Rain (77066) | Not Updated | 06/01/2021 - 12/23/2025 | No Error Logged | 0 | |
| Houston Rain (77068) | Not Updated | 05/28/2021 - 12/23/2025 | No Error Logged | 0 | |
| Houston Rain (77070) | Not Updated | 06/01/2021 - 12/23/2025 | No Error Logged | 0 | |
| Houston Rain (77071) | Not Updated | 05/28/2021 - 12/23/2025 | No Error Logged | 0 | |
| Houston Rain (77072) | Not Updated | 06/01/2021 - 12/23/2025 | No Error Logged | 0 | |
| Houston Rain (77073) | Not Updated | 05/28/2021 - 12/23/2025 | No Error Logged | 0 | |
| Houston Rain (77075) | Not Updated | 05/28/2021 - 12/23/2025 | No Error Logged | 0 | |
| Houston Rain (77077) | Not Updated | 05/28/2021 - 12/23/2025 | No Error Logged | 0 | |
| Houston Rain (77079) | Not Updated | 05/28/2021 - 12/23/2025 | No Error Logged | 0 | |
| Houston Rain (77080) | Not Updated | 06/01/2021 - 12/23/2025 | No Error Logged | 0 | |
| Houston Rain (77082) | Not Updated | 05/28/2021 - 12/23/2025 | No Error Logged | 0 | |
| Houston Rain (77083) | Not Updated | 05/28/2021 - 12/23/2025 | No Error Logged | 0 | |
| Houston Rain (77084) | Not Updated | 06/01/2021 - 12/23/2025 | No Error Logged | 0 | |
| Houston Rain (77087) | Not Updated | 05/28/2021 - 12/23/2025 | No Error Logged | 0 | |
| Houston Rain (77088) | Not Updated | 06/01/2021 - 12/06/2025 | No Error Logged | 0 | |
| Houston Rain (77089) | Not Updated | 06/01/2021 - 12/23/2025 | No Error Logged | 0 | |
| Houston Rain (77090) | Not Updated | 05/28/2021 - 12/23/2025 | No Error Logged | 0 | |
| Houston Rain (77091) | Not Updated | 05/28/2021 - 12/06/2025 | No Error Logged | 0 | |
| Houston Rain (77092) | Not Updated | 06/01/2021 - 12/23/2025 | No Error Logged | 0 | |
| Houston Rain (77093) | Not Updated | 05/28/2021 - 12/23/2025 | No Error Logged | 0 | |
| Houston Rain (77094) | Not Updated | 05/28/2021 - 12/23/2025 | No Error Logged | 0 | |
| Houston Rain (77095) | Not Updated | 05/28/2021 - 12/06/2025 | No Error Logged | 0 | |
| Houston Rain (77099) | Not Updated | 06/01/2021 - 12/23/2025 | No Error Logged | 0 | |
| Houston Rain (77502) | Not Updated | 06/01/2021 - 12/23/2025 | No Error Logged | 0 | |
| Huffman Rain (77336) | Not Updated | 06/01/2021 - 12/23/2025 | No Error Logged | 0 | |
| Humble Rain (77338) | Not Updated | 06/01/2021 - 12/23/2025 | No Error Logged | 0 | |
| Humble Rain (77396) | Not Updated | 06/01/2021 - 12/23/2025 | No Error Logged | 0 | |
| Katy Rain (77449) | Not Updated | 06/01/2021 - 12/06/2025 | No Error Logged | 0 | |
| Katy Rain (77450) | Not Updated | 06/01/2021 - 12/23/2025 | No Error Logged | 0 | |
| Katy Rain (77493) | Not Updated | 06/01/2021 - 12/23/2025 | No Error Logged | 0 | |
| Katy Rain (77494) | Not Updated | 06/01/2021 - 12/23/2025 | No Error Logged | 0 | |
| La Porte Rain (77571) | Not Updated | 06/01/2021 - 12/23/2025 | No Error Logged | 0 | |
| League City Rain (77573) | Not Updated | 06/01/2021 - 12/23/2025 | No Error Logged | 0 | |
| Magnolia Rain (77354) | Not Updated | 06/01/2021 - 12/23/2025 | No Error Logged | 0 | |
| Magnolia Rain (77355) | Not Updated | 06/01/2021 - 12/23/2025 | No Error Logged | 0 | |
| McKinney Rain | Not Updated | 01/20/2016 - 12/23/2025 | No Error Logged | 0 | |
| Mesquite Rain | Not Updated | 01/20/2016 - 12/23/2025 | No Error Logged | 0 | |
| New Caney Rain (77357) | Not Updated | 06/01/2021 - 12/23/2025 | No Error Logged | 0 | |
| Pasadena Rain (77506) | Not Updated | 06/01/2021 - 12/23/2025 | No Error Logged | 0 | |
| Pasadena Rain (77507) | Not Updated | 01/01/0001 - 01/01/0001 | No Error Logged | 0 | |
| Pearland Rain (77581) | Not Updated | 06/01/2021 - 12/23/2025 | No Error Logged | 0 | |
| Pinehurst Rain (77362) | Not Updated | 06/01/2021 - 12/23/2025 | No Error Logged | 0 | |
| Plano Rain | Not Updated | 01/20/2016 - 01/06/2025 | No Error Logged | 0 | |
| Plantersville Rain (77363) | Not Updated | 06/01/2021 - 12/23/2025 | No Error Logged | 0 | |
| Porter Rain (77365) | Not Updated | 06/01/2021 - 12/23/2025 | No Error Logged | 0 | |
| Princeton Rain | Not Updated | 01/20/2016 - 12/23/2025 | No Error Logged | 0 | |
| Richardson Rain | Not Updated | 01/20/2016 - 12/23/2025 | No Error Logged | 0 | |
| Richmond Rain (77407) | Not Updated | 06/01/2021 - 12/23/2025 | No Error Logged | 0 | |
| Rockwall Rain | Not Updated | 01/20/2016 - 12/22/2025 | No Error Logged | 0 | |
| Royse City Rain | Not Updated | 01/20/2016 - 12/23/2025 | No Error Logged | 0 | |
| Seabrook Rain (77586) | Not Updated | 06/01/2021 - 12/23/2025 | No Error Logged | 0 | |
| South Houston Rain (77587) | Not Updated | 06/01/2021 - 12/23/2025 | No Error Logged | 0 | |
| Splendora Rain (77372) | Not Updated | 06/01/2021 - 12/23/2025 | No Error Logged | 0 | |
| Spring Rain (77373) | Not Updated | 06/01/2021 - 12/23/2025 | No Error Logged | 0 | |
| Spring Rain (77382) | Not Updated | 06/01/2021 - 12/23/2025 | No Error Logged | 0 | |
| Spring Rain (77389) | Not Updated | 06/01/2021 - 12/23/2025 | No Error Logged | 0 | |
| Tomball Rain (77375) | Not Updated | 06/01/2021 - 12/23/2025 | No Error Logged | 0 | |
| Tomball Rain (77377) | Not Updated | 06/01/2021 - 12/06/2025 | No Error Logged | 0 | |
| Waller Rain (77484) | Not Updated | 06/01/2021 - 12/06/2025 | No Error Logged | 0 | |
| Webster Rain (77598) | Not Updated | 06/01/2021 - 12/23/2025 | No Error Logged | 0 | |
| Wylie Rain | Not Updated | 01/20/2016 - 12/23/2025 | No Error Logged | 0 |